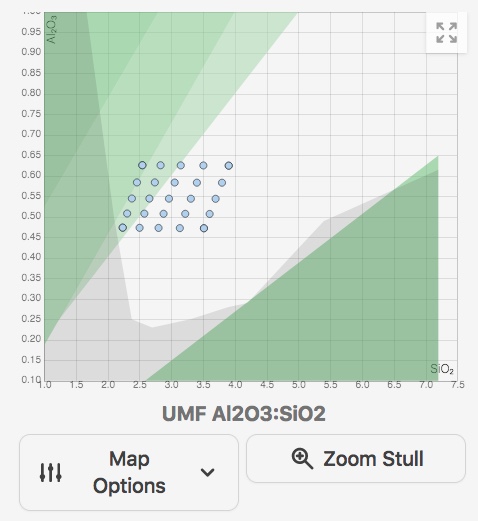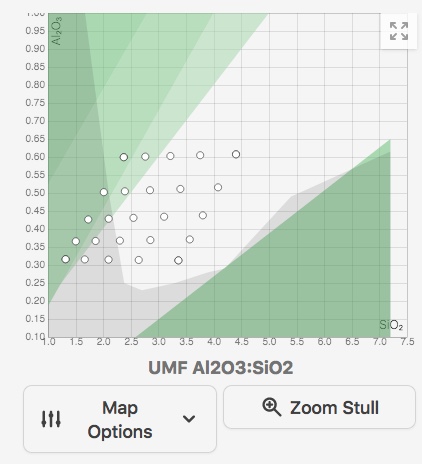
There was a discussion on the Clayart Listserv group about the Rhodes 32 glaze. This is where Rhodes 32 lands on the Stull Map - it lands in the semi-matte region. Rhodes 32 has a problem with cutlery marking and the discussion revolved around how to correct that.
This type of grid can help you spot trends. The glazes on the left are matte. As silica is added they move into the glossy range. You can see that some of the matte glazes on the left are runny. That is what happens when a matte glaze is over-fired - it runs. But if you add silica to that same matte glaze, it turns glossy and you can see that happening in this grid.
This is the Stull Map for the biaxial grid set of mine. If you study this image, you will see that many of the glazes are in the matte and semi-matte region on the Stull Map. This corresponds well with my fired results. Notice that the glossy glazes that I generated with that grid set are plotted in the glossy area of this Stull Map.
I think of the Stull Map as a compass. It can help you spot the trends that happen in a glaze when you vary the amounts of alumina and silica in that glaze. The line between semi-matte and glossy is not a hard and fast rule where moving one small bit over that line from the semi-matte to the glossy region generates a glossy glaze. Rather what happens is that if you create a biaxial grid of your glaze, you can use it to spot the trends and then zero in on the results you wish to explore. Looking at the fired results of this grid has led me to make up a batch of glaze A2 because it is a lovely blue-green matte with crystals.


No comments:
Post a Comment
Comments are moderated.
I check them daily.
Please be kind and be patient.